Direct OTEL SDK-to-Sentry
There are multiple ways to send OTLP data to Sentry:
- Direct OTEL SDK → Sentry (this guide) - Simplest setup, SDK sends directly to Sentry
- OTEL SDK → OpenTelemetry Collector → Sentry - More control, can process/filter data
- Platform Drains → Sentry - No SDK needed, cloud platforms automatically forward logs and traces (Vercel, Cloudflare, etc.)
We’ll start with the direct approach since it’s the fastest way to get data flowing.
Getting Your Sentry OTLP Credentials
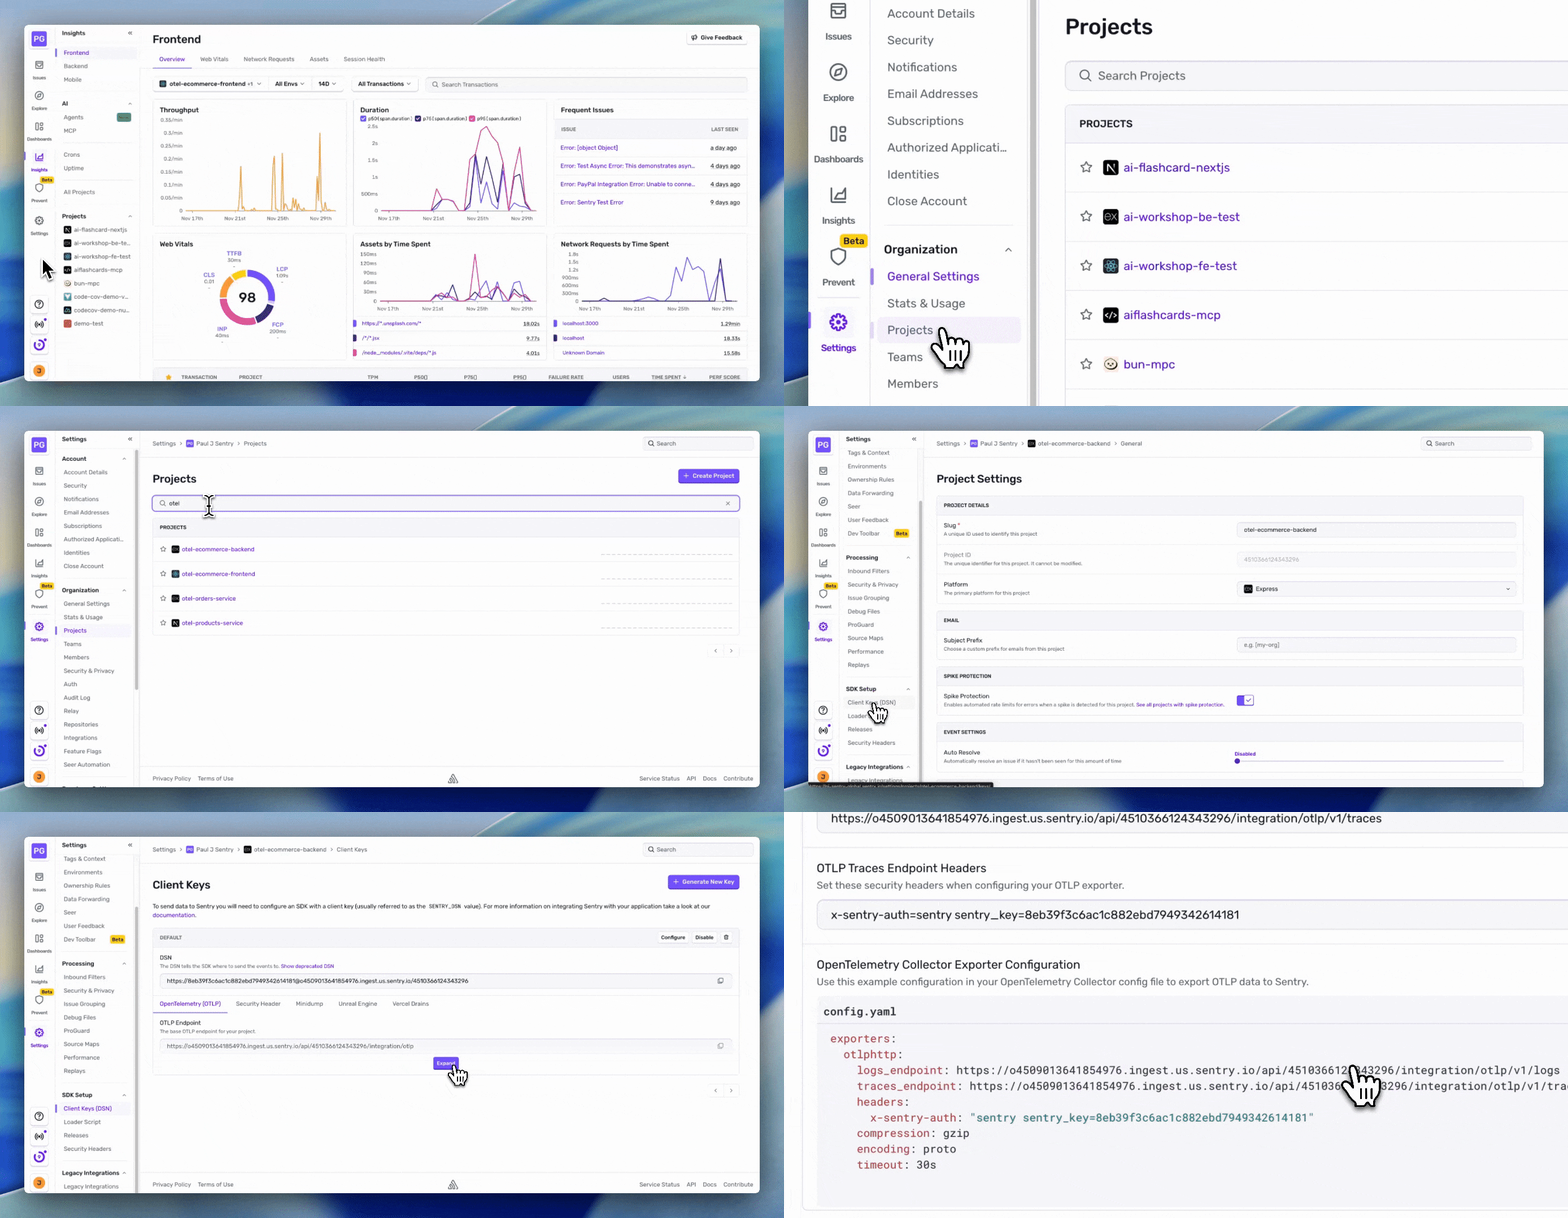
Sentry provides all the OTLP configuration you need directly in the UI
-
Open your Sentry project
-
Navigate to Client Keys (DSN)
Go to Settings > Projects > [Your Project] > Client Keys (DSN)
-
Click the OpenTelemetry (OTLP) tab
Copy the following values (click the copy icon next to each):
- OTLP Logs Endpoint - The full URL for sending logs
- OTLP Logs Endpoint Headers - The authentication header for logs
- OTLP Traces Endpoint - The full URL for sending traces
- OTLP Traces Endpoint Headers - The authentication header for traces

Configuring SDK Direct Mode
Now let’s configure the backend API to send data directly to Sentry’s OTLP endpoints.
-
Add your Sentry OTLP configuration to the
api/.envfileTerminal window # Sentry OTLP Logs Endpoint & Auth Header (paste from Sentry UI)OTEL_EXPORTER_OTLP_LOGS_ENDPOINT=<paste OTLP Logs Endpoint>OTEL_EXPORTER_OTLP_LOGS_HEADERS=<paste OTLP Logs Endpoint Header># Sentry OTLP Traces Endpoint & Auth Header (paste from Sentry UI)OTEL_EXPORTER_OTLP_TRACES_ENDPOINT=<paste OTLP Traces Endpoint>OTEL_EXPORTER_OTLP_TRACES_HEADERS=<paste OTLP Traces Endpoint Header>Note: leave off the quotes around the headers values. This is nuance for this demo we’ll talk about later.
-
Restart (if running from earlier) the backend server in direct mode
Terminal window npm run demo:directYou should see output like this:
📡 Mode: DIRECT (SDK → Sentry)📡 Exporting to: https://o4509013641854976.ingest.us.sentry.io/api/...🔭 OpenTelemetry instrumentation initialized📊 Service: sentry-build-otlp-workshop-api... more output ...✅ All services initialized successfully
What’s Happening Behind the Scenes
The application’s backend is already configured with OpenTelemetry instrumentation (in api/instrument-otel.js). Here’s what’s happening:
1. OTLP Exporters Configuration
The environment variables you set in .env are loaded and used to create OTLP exporters that send data to Sentry:
// From api/instrument-otel.js
// Direct mode: App sends directly to Sentry (single project)// Headers are automatically parsed from OTEL_EXPORTER_OTLP_TRACES_HEADERS env var by the exporterconst traceExporter = new OTLPTraceExporter({  url: process.env.OTEL_EXPORTER_OTLP_TRACES_ENDPOINT,});
const logExporter = new OTLPLogExporter({  url: process.env.OTEL_EXPORTER_OTLP_LOGS_ENDPOINT,});
Both the trace exporter and log exporter are configured in the NodeSDK:
// From api/instrument-otel.js
// Initialize OpenTelemetry SDKconst sdk = new NodeSDK({  resource,  traceExporter,  logRecordProcessors: [new BatchLogRecordProcessor(logExporter)],  instrumentations: [    getNodeAutoInstrumentations({      '@opentelemetry/instrumentation-fs': {        enabled: false,      },      '@opentelemetry/instrumentation-http': {        enabled: true,        ignoreIncomingPaths: ['/health'],      },      '@opentelemetry/instrumentation-express': {        enabled: true,      },      '@opentelemetry/instrumentation-pg': {        enabled: true,        enhancedDatabaseReporting: true,      },      '@opentelemetry/instrumentation-redis-4': {        enabled: true,      },    }),  ],});
sdk.start();
Once the SDK starts, all instrumented operations (HTTP requests, database queries, etc.) will automatically send their trace and log data to your Sentry project!
2. Automatic Instrumentation
OpenTelemetry automatically captures:
- HTTP (
instrumentation-http): Incoming requests to your API AND outgoing HTTP calls (like the payment gateway). Health checks and CORS preflight requests are ignored to reduce noise. - Express (
instrumentation-express): Route handlers and middleware - PostgreSQL (
instrumentation-pg): Database queries with query text and duration (enhanced reporting enabled) - Redis (
instrumentation-redis-4): Cache get/set operations
Note: File system instrumentation is disabled by default as it generates too much noise.
3. Manual Instrumentation
The application also includes custom spans for business logic:
// Example from api/src/services/payment.jsimport { withSpan } from '../utils/tracer.js';
async function processPayment(orderId, amount) {  return withSpan('payment.process', async (span) => {    span.setAttribute('order.id', orderId);    span.setAttribute('payment.amount', amount);
    // Simulate payment processing    const success = Math.random() > 0.1; // 90% success rate
    if (!success) {      span.addEvent('payment-failed');      throw new Error('Payment declined');    }
    return { success: true, transactionId: 'tx_' + Date.now() };  });}
These custom spans give you business-specific context in your traces.
4. Resource Attributes
Every span includes resource attributes that identify your service:
{ "service.name": "otel-ecommerce-api", "service.version": "1.0.0", "deployment.environment": "development"}These help you filter and organize traces in Sentry, especially when you have multiple services.
Testing the Direct Integration
Now that you understand how the backend is configured for direct mode, let’s verify it’s sending data to Sentry.
-
Generate some traffic
Terminal window # Open a new terminal window (keep the backend server running in the other terminal)# Simple health checkcurl http://localhost:3000/health# Fetch products (triggers database and cache operations)curl http://localhost:3000/api/products# Or run the load test to generate realistic trafficnpm run test:apiThe load test will generate ~40 traces with various scenarios:
- Product fetching (cache hits and misses)
- Order creation
- Payment processing (including failures)
- Inventory checks
-
Verify data in Sentry
- Go to your Sentry project
- Navigate to Explore › Traces
- You should see traces appearing from your API!
Look for traces with operations like:
GET /api/productsPOST /api/orders- Database queries (PostgreSQL)
- Cache operations (Redis)
What to Look For in Sentry
Once you’ve generated some traffic, here’s what you should see in Sentry:
Traces Tab
Navigate to Explore › Traces and you’ll see the Span Samples tab displaying:
- Span Name: The operation type (e.g.,
GET,cache.get,pg-pool.connect) - Span Description: Full operation details (e.g.,
GET /api/products) - Span Duration: How long each operation took
- Transaction: Parent transaction (may show “(no value)” for standalone spans)
- Timestamp: When the span occurred
Trace Details
Click on any span in the Span Samples tab to open the trace waterfall view, where you’ll see:
- Waterfall view (left): Visual timeline showing the hierarchy of spans with their durations
- Span Details panel (right): Opens when you click on a span, showing:
- Span ID: Unique identifier for the span
- Span attributes: category, description, duration, name, op (operation), self_time, status
- Context data: Browser info, device details, client_sample_rate
- Custom attributes: Any business data you’ve added to spans
Learn more about the Trace Explorer view in the Sentry documentation.