Using the OpenTelemetry Collector with Sentry
Why Use the Collector?
The Collector is useful when you need to:
- Send telemetry to multiple backends simultaneously
- Centralize telemetry configuration across multiple services
- Transform, filter, or enrich data before sending to Sentry
- Handle high-volume telemetry with batching and buffering
Collector Configuration for Sentry
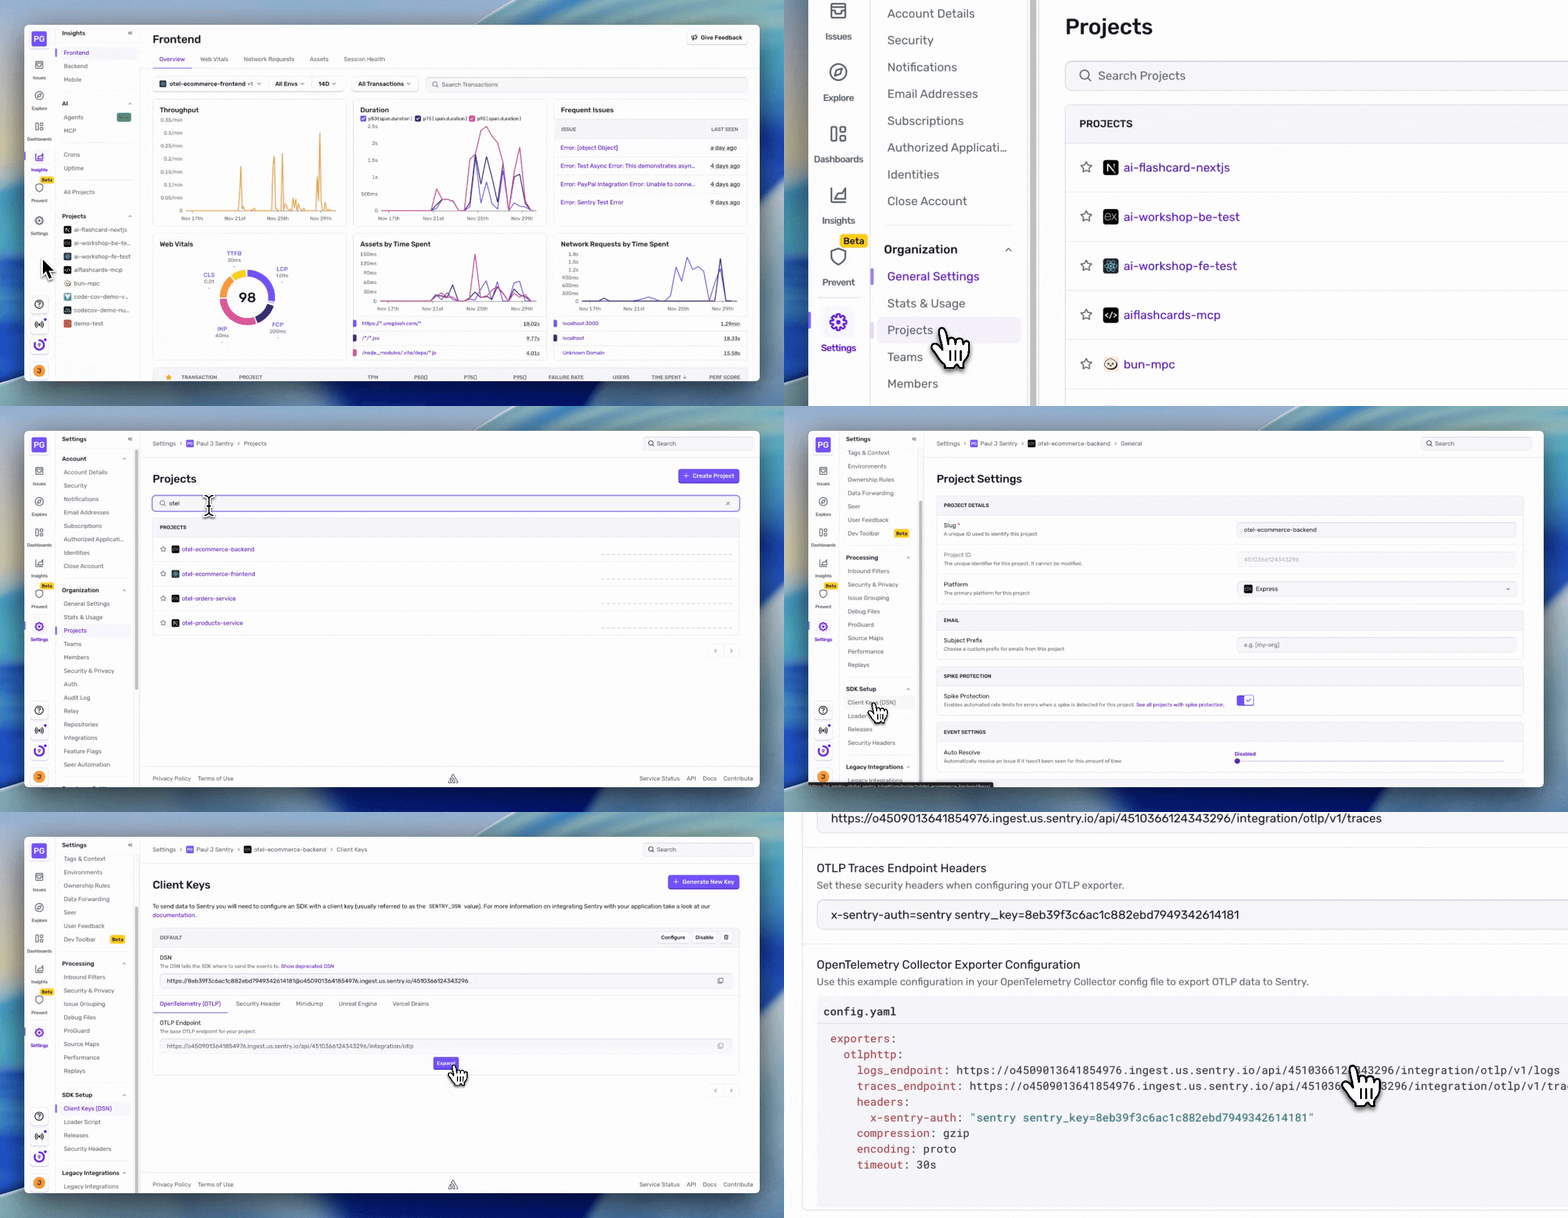
1. Get Your Sentry OTLP Configuration
Sentry provides the exporter configuration directly in the UI:
- Go to Settings > Projects > [Your Project] > Client Keys (DSN)
- Click the OpenTelemetry (OTLP) tab
- Scroll down to the OpenTelemetry Collector section
- Copy the exporter configuration shown

2. Basic Collector Configuration
Here’s an example collector configuration for a single Sentry project, using the exporter configuration from Sentry’s UI:
receivers:  otlp:    protocols:      http:        endpoint: 0.0.0.0:4318      grpc:        endpoint: 0.0.0.0:4317
processors:  batch:    timeout: 10s    send_batch_size: 100
exporters:  otlphttp:    logs_endpoint: https://your-org.ingest.us.sentry.io/api/PROJECT_ID/integration/otlp/v1/logs    traces_endpoint: https://your-org.ingest.us.sentry.io/api/PROJECT_ID/integration/otlp/v1/traces    headers:      x-sentry-auth: "sentry sentry_key=YOUR_KEY"    compression: gzip    encoding: proto    timeout: 30s
service:  pipelines:    traces:      receivers: [otlp]      processors: [batch]      exporters: [otlphttp]
logs: receivers: [otlp] processors: [batch] exporters: [otlphttp]Routing to Multiple Sentry Projects
Let’s set up two separate Node.js Sentry projects to send telemetry to:
otel-products-serviceotel-orders-service
Routing by Service Name
After you’ve set up your different Sentry projects, you can configure the Collector to route data to them based on service name. This uses the OTEL Collector’s routing connector.
This example uses environment variables for better security and easier configuration management. First, set up your environment variables for each Sentry project:
# Products Service - Sentry OTLP Endpoints & Auth (paste from Sentry UI)SENTRY_PRODUCTS_TRACES_ENDPOINT=<paste OTLP Traces Endpoint>SENTRY_PRODUCTS_LOGS_ENDPOINT=<paste OTLP Logs Endpoint>
# When copying auth from Sentry settings, paste the part AFTER "x-sentry-auth="# Example: if Sentry shows "x-sentry-auth=sentry sentry_key=ABC", paste "sentry sentry_key=ABC"SENTRY_PRODUCTS_AUTH=<paste the value after x-sentry-auth=>
# Orders Service - Sentry OTLP Endpoints & Auth (paste from Sentry UI)SENTRY_ORDERS_TRACES_ENDPOINT=<paste OTLP Traces Endpoint>SENTRY_ORDERS_LOGS_ENDPOINT=<paste OTLP Logs Endpoint>
# When copying auth from Sentry settings, paste the part AFTER "x-sentry-auth="SENTRY_ORDERS_AUTH=<paste the value after x-sentry-auth=>
Then create .api/collector-config.yaml in the application and configure the collector to use these environment variables:
This configuration sets up a routing-based pipeline that directs telemetry to different Sentry projects based on the service.name resource attribute. Here’s how it works:
- Receivers accept incoming OTLP data over gRPC (port 4317) and HTTP (port 4318)
- Routing Connectors inspect each trace/log and route it to the appropriate pipeline based on which service generated it
- Exporters send the routed data to the correct Sentry project using the corresponding DSN credentials
- Pipelines wire everything together: primary pipelines receive and route, while service-specific pipelines export to their designated Sentry projects
# OpenTelemetry Collector Configuration - Multi-Project Routing# Routes telemetry to separate Sentry projects based on service.name
receivers:  otlp:    protocols:      grpc:        endpoint: 0.0.0.0:4317      http:        endpoint: 0.0.0.0:4318
connectors:  routing/traces:    default_pipelines: [traces/orders]  # Gateway and other services go here    error_mode: ignore    table:      # Products Service      - statement: route() where resource.attributes["service.name"] == "products-service"        pipelines: [traces/products]
      # Orders Service      - statement: route() where resource.attributes["service.name"] == "orders-service"        pipelines: [traces/orders]
  routing/logs:    default_pipelines: [logs/orders]  # Gateway and other services go here    error_mode: ignore    table:      # Products Service      - statement: route() where resource.attributes["service.name"] == "products-service"        pipelines: [logs/products]
      # Orders Service      - statement: route() where resource.attributes["service.name"] == "orders-service"        pipelines: [logs/orders]
exporters:  # Products Service  otlphttp/products-traces:    traces_endpoint: ${env:SENTRY_PRODUCTS_TRACES_ENDPOINT}    headers:      x-sentry-auth: ${env:SENTRY_PRODUCTS_AUTH}    compression: gzip    encoding: proto
  otlphttp/products-logs:    logs_endpoint: ${env:SENTRY_PRODUCTS_LOGS_ENDPOINT}    headers:      x-sentry-auth: ${env:SENTRY_PRODUCTS_AUTH}    compression: gzip    encoding: proto
  # Orders Service  otlphttp/orders-traces:    traces_endpoint: ${env:SENTRY_ORDERS_TRACES_ENDPOINT}    headers:      x-sentry-auth: ${env:SENTRY_ORDERS_AUTH}    compression: gzip    encoding: proto
  otlphttp/orders-logs:    logs_endpoint: ${env:SENTRY_ORDERS_LOGS_ENDPOINT}    headers:      x-sentry-auth: ${env:SENTRY_ORDERS_AUTH}    compression: gzip    encoding: proto
service:  telemetry:    logs:      level: info  pipelines:    # Primary pipelines - receive and route    traces:      receivers: [otlp]      exporters: [routing/traces]
    logs:      receivers: [otlp]      exporters: [routing/logs]
    # Products service pipelines    traces/products:      receivers: [routing/traces]      exporters: [otlphttp/products-traces]
    logs/products:      receivers: [routing/logs]      exporters: [otlphttp/products-logs]
    # Orders service pipelines    traces/orders:      receivers: [routing/traces]      exporters: [otlphttp/orders-traces]
    logs/orders:      receivers: [routing/logs]      exporters: [otlphttp/orders-logs]
Running the Collector with Routing
Now let’s test the collector configuration and verify data is being routed to the correct Sentry projects:
*Stop the server running in direct mode if it’s still running.
-
Start the collector in routing mode
Terminal window npm run demo:collectorThis starts the OpenTelemetry Collector with the routing configuration and configures the application to send telemetry to the local collector (localhost:4318).
-
Generate traffic
Use the app via the browser or run the load test to generate traffic
-OR-
In a new terminal, run the load test:
Terminal window npm run test:apiThe load test will generate traces with different service names:
products-service- Product fetching and cache operationsorders-service- Order creation and payment processing
What to Look For in Sentry
Once you’ve generated some traffic, here’s what you should see in Sentry:
Traces Tab
Navigate to Explore › Traces and you’ll see the Span Samples tab displaying:
- Span Name: The operation type (e.g.,
GET,cache.get,pg-pool.connect) - Span Description: Full operation details (e.g.,
GET /api/products) - Span Duration: How long each operation took
- Transaction: Parent transaction (may show “(no value)” for standalone spans)
- Timestamp: When the span occurred
Trace Details
Click on any span in the Span Samples tab to open the trace waterfall view, where you’ll see:
- Waterfall view (left): Visual timeline showing the hierarchy of spans with their durations
- Span Details panel (right): Opens when you click on a span, showing:
- Span ID: Unique identifier for the span
- Span attributes: category, description, duration, name, op (operation), self_time, status
- Context data: Browser info, device details, client_sample_rate
- Custom attributes: Any business data you’ve added to spans
Learn more about the Trace Explorer view in the Sentry documentation.
What’s Next?
Configure distributed tracing: Enable propagateTraceparent to connect frontend and backend traces across projects