Distributed Tracing in Sentry
Before we configure OpenTelemetry to send data to Sentry, it’s important to understand what distributed tracing is and how Sentry uses it. This will help you understand what you’re looking for when verifying your setup and debugging issues later.
What is Distributed Tracing?
The ultimate goal.
Distributed tracing tracks a request as it flows through multiple services in your application. Instead of looking at logs from each service separately, distributed tracing gives you a unified view of the entire request journey - from the user’s browser, through your API, to your database and back.
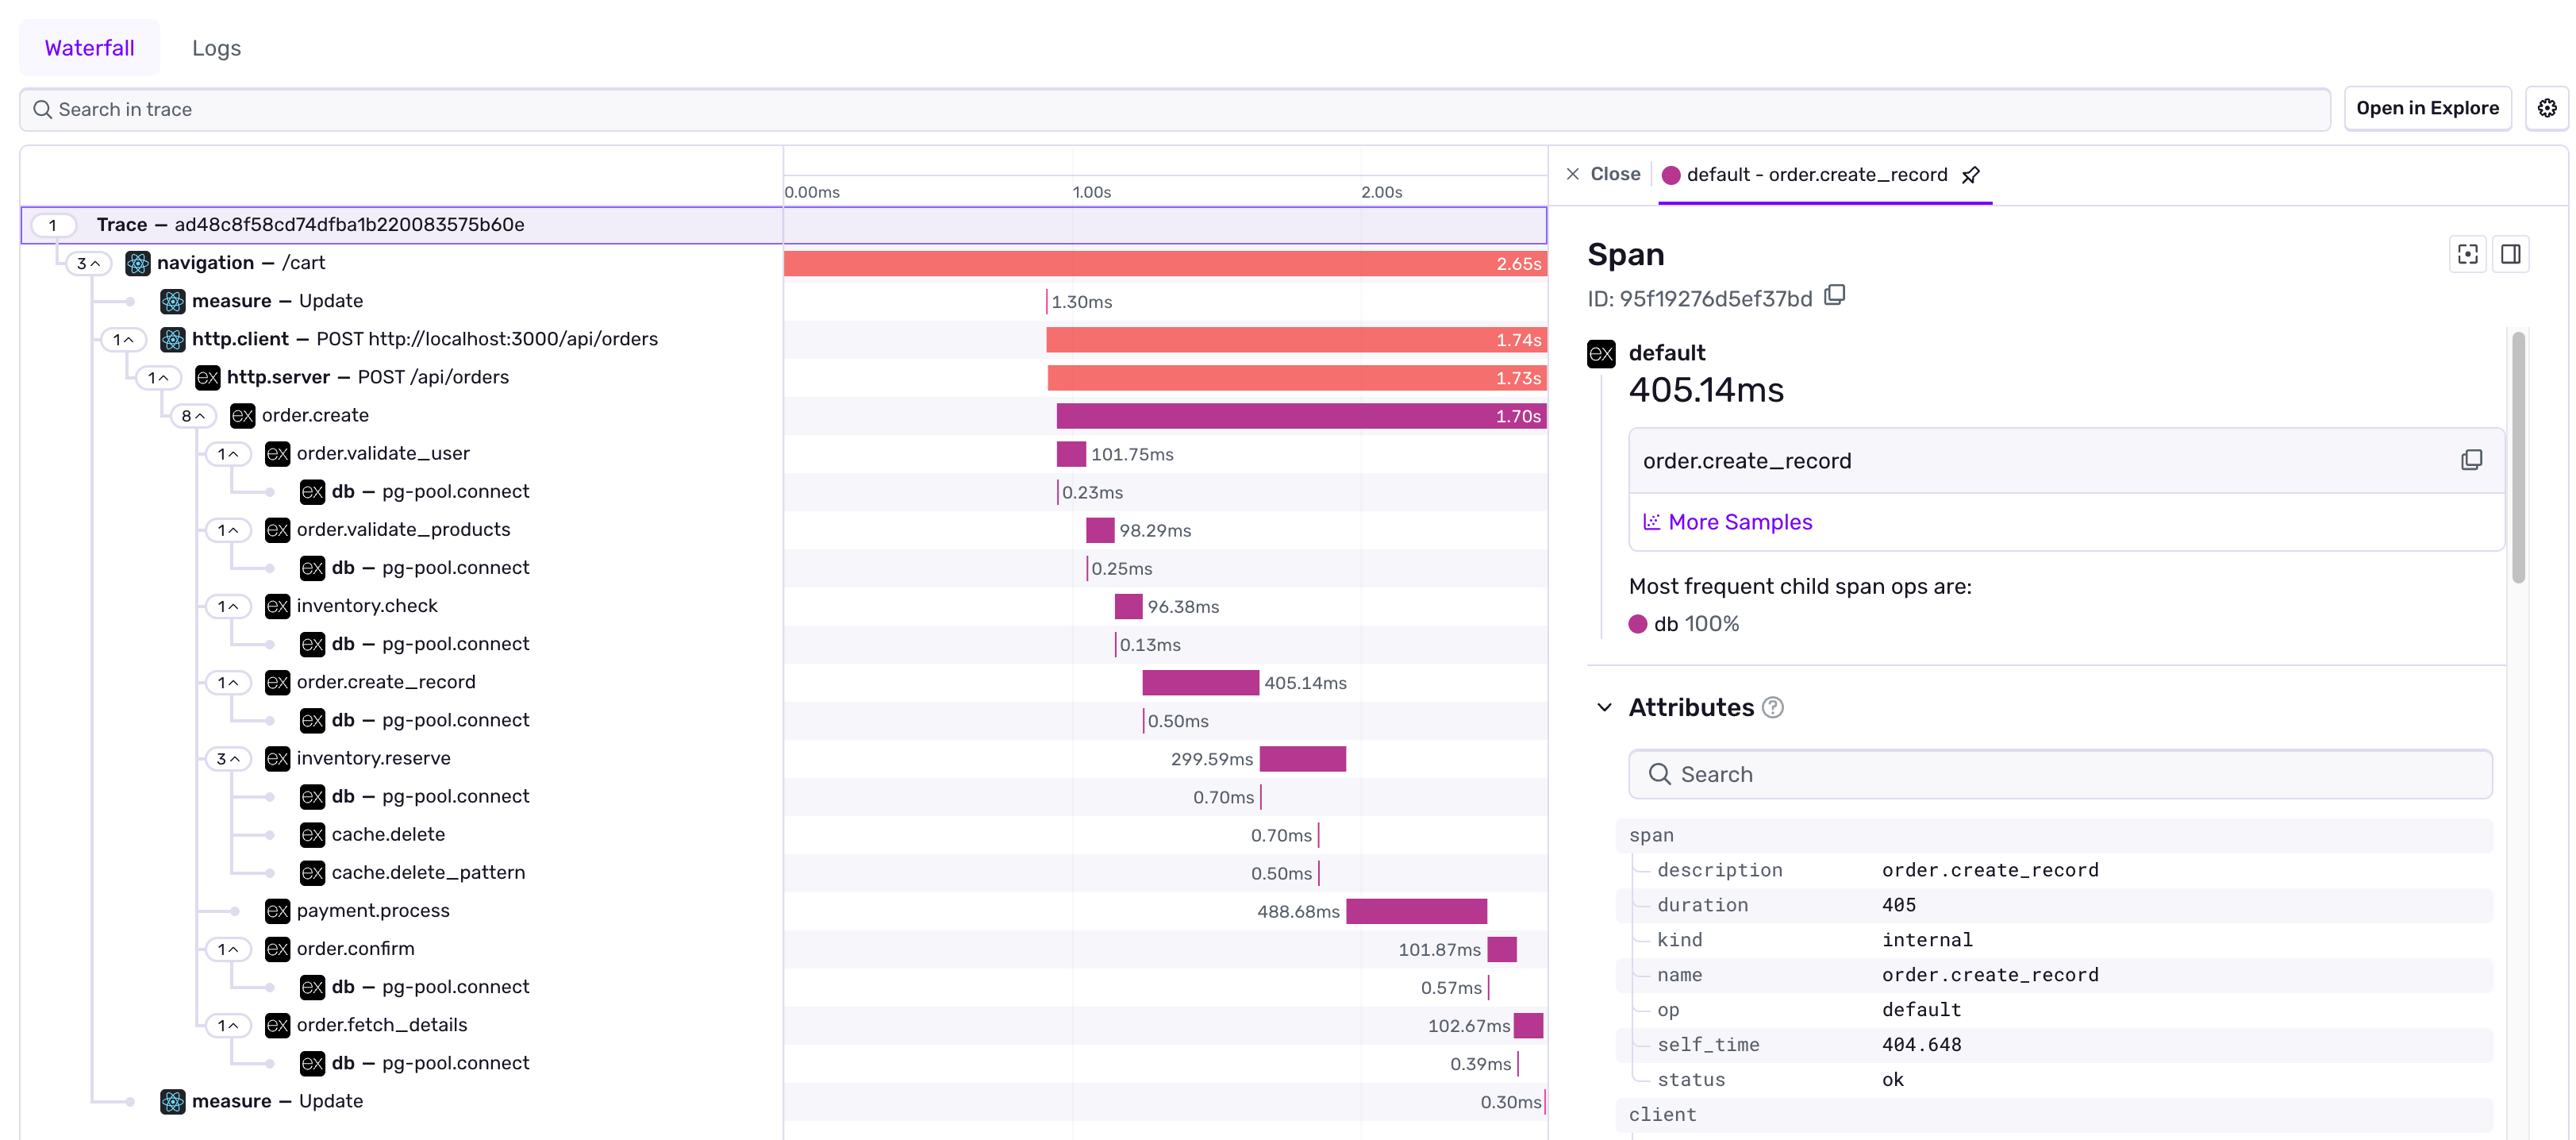
This waterfall view shows:
- What happened: Each operation performed
- Where it happened: Which service handled each operation
- When it happened: The sequence of operations
- How long it took: Performance bottlenecks
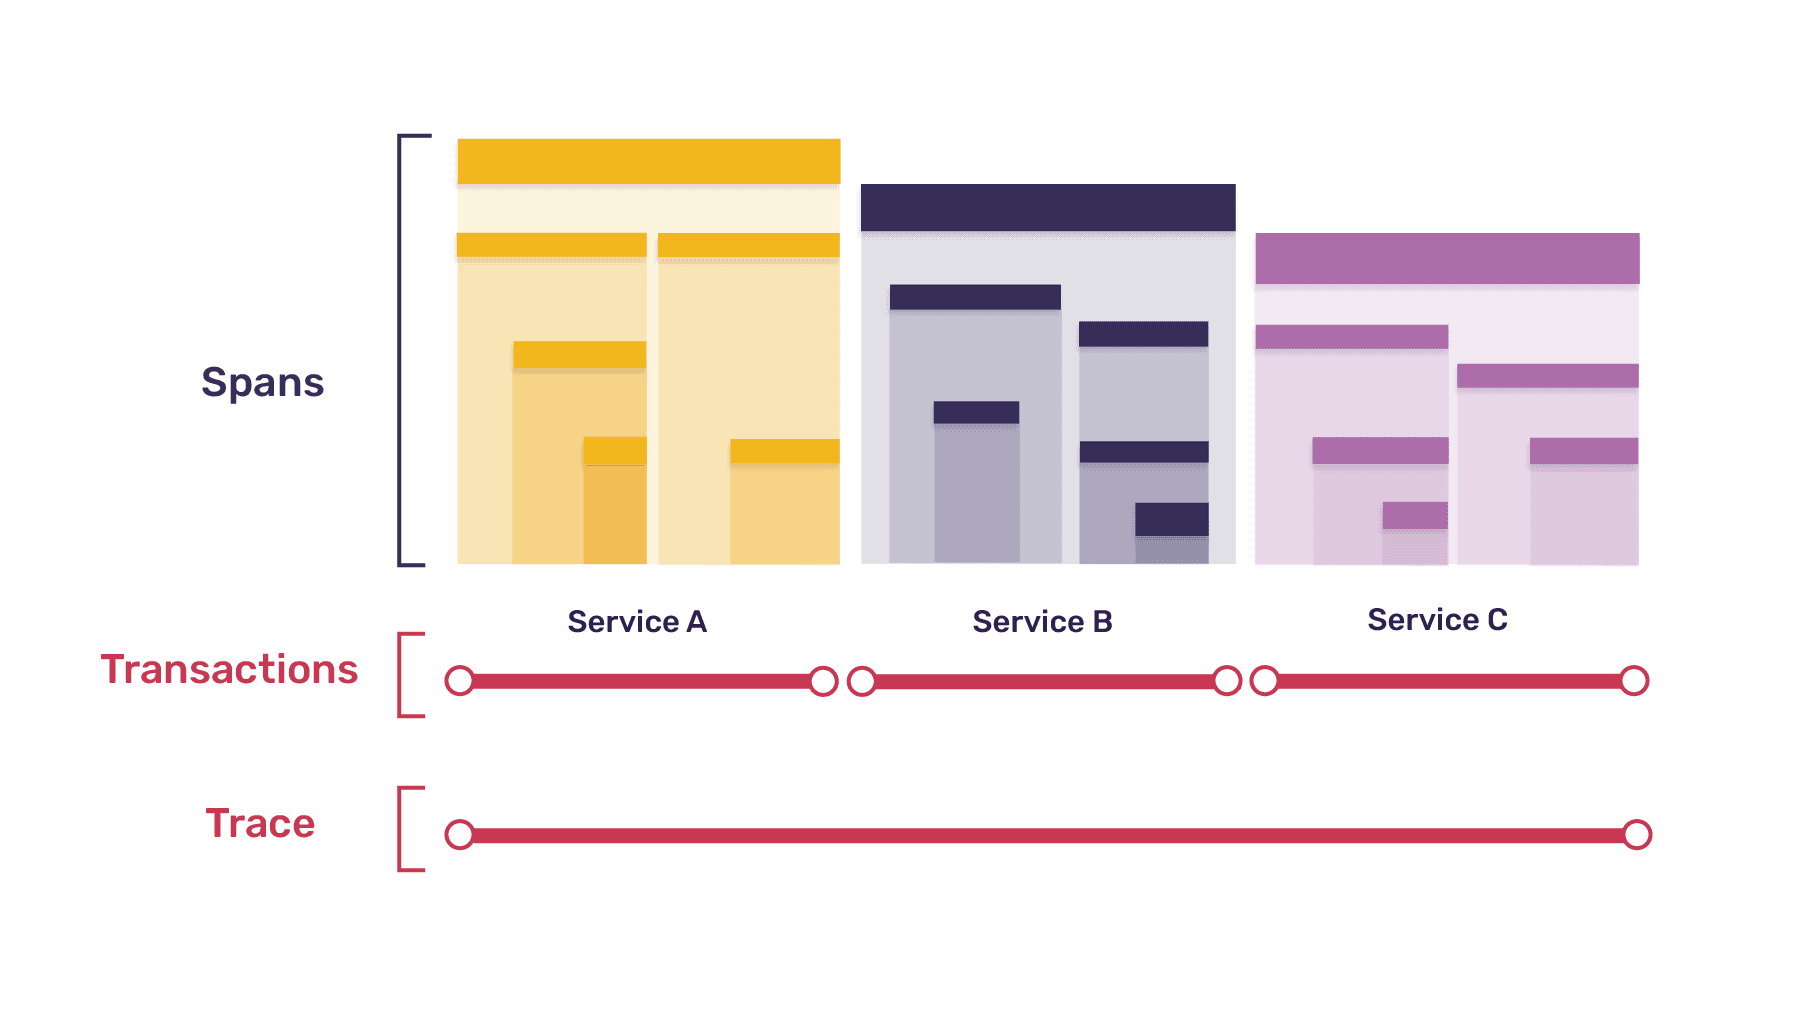
The Anatomy of a Trace
Distributed tracing is built on three key concepts:
Understanding Traces and Spans
Traces
A trace represents the entire journey of a request through your system. For example, when a user clicks “Place Order” in your e-commerce app, a trace captures everything that happens:
- The page load in the browser
- The API call to create the order
- Database queries to check inventory
- Redis cache lookups for product data
- External API calls to process payment
Each trace has a unique Trace ID that connects all related operations across services.
Spans
A span represents a single operation within a trace. Spans show you the details of what’s happening. Examples include:
- HTTP requests: Calling an external API
- Database queries:
SELECT * FROM products WHERE id = ? - Cache operations: Getting or setting a value in Redis
- Business logic: Custom operations like “processing payment” or “checking inventory”
Spans can have parent-child relationships, creating a tree structure that shows which operations triggered which.
How Sentry Connects Traces: HTTP Headers
For distributed tracing to work across services, your frontend needs to tell the backend “I’m part of trace XYZ - continue tracking this request.” Sentry does this automatically through HTTP headers.
Sentry’s Trace Headers
When Sentry is configured on your frontend with tracing enabled, it automatically adds headers to outgoing API requests:
// When your frontend makes an API call, Sentry automatically adds:fetch('http://localhost:3000/api/orders', { headers: { 'sentry-trace': '4bf92f3577b34da6a3ce929d0e0e4736-00f067aa0ba902b7-1', 'baggage': 'sentry-trace_id=4bf92f3577b34da6a3ce929d0e0e4736,sentry-environment=production,sentry-release=1.0.0' }})What Each Header Contains
sentry-trace - The core trace information:
- Trace ID: The unique identifier for this entire request journey (32 hex characters)
- Parent Span ID: Which operation in the frontend triggered this call (16 hex characters)
- Sampled: Whether this trace is being recorded (1) or dropped (0)
baggage - Additional metadata about the trace:
- Sentry Trace ID
- Sentry Environment
- Sentry Release
- Sentry Public Key
Why This Matters
When your backend receives these headers, it can:
- Extract the Trace ID and continue the same trace (not create a new one)
- Use the Parent Span ID to create spans that are children of the frontend operation
- Apply the same sampling decision so you don’t lose part of a trace
- Inherit context like environment and release information
This is what creates the unified view in Sentry where you can see the complete journey from browser click → API call → database query → response, all in one trace!